Looking at changes in vegetative health at Glacier National Park, 2015-2020

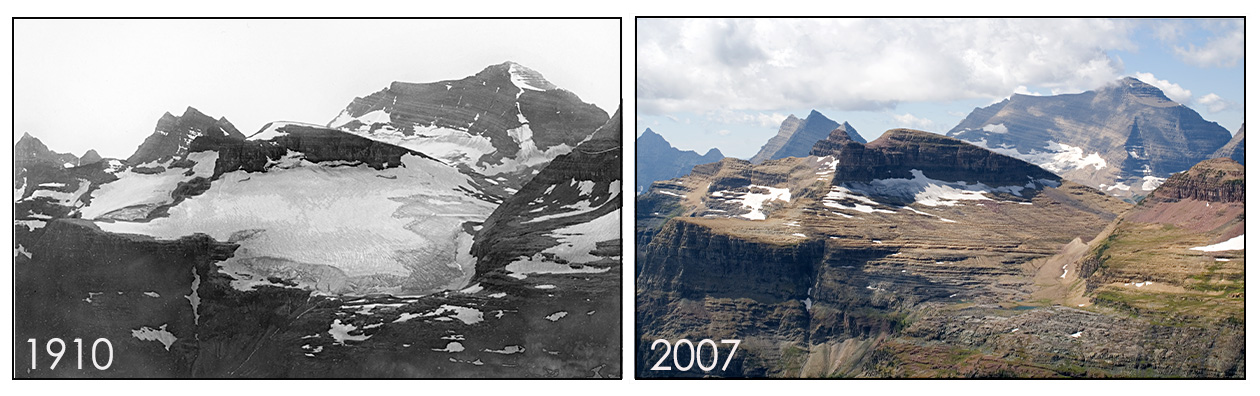
Glacier National Park is warming at nearly two times the global average [1] threatening the very glaciers after which the park is named [2]. The plants and animals that call the park home are also being impacted by warming, including the potato-sized, furry, North American pika (Ochotona princeps) [3]. Additional stressors to the forest ecosystems inside Glacier National Park include various rusts, worms, and beetles [4], as well as fire [5].

Grinell Glacier; Glacier National Park 2010-2016; Source: USGS Grinnell Glacier; Glacier National Park; Image Credit: 1910-Elrod photo, U of M Collection and 2016-McKeon photo, USGS

References

  • [1] https://www.nps.gov/glac/learn/nature/climate-change.htm
  • [2] https://www.usgs.gov/centers/norock/science/repeat-photography-project
  • [3] https://www.nps.gov/articles/pikas-brief.htm
  • [4] https://www.nps.gov/articles/forest-health-brief.htm
  • [5] https://www.nps.gov/glac/learn/nature/fire-history.htm

An open Environmental Data Science Workflow

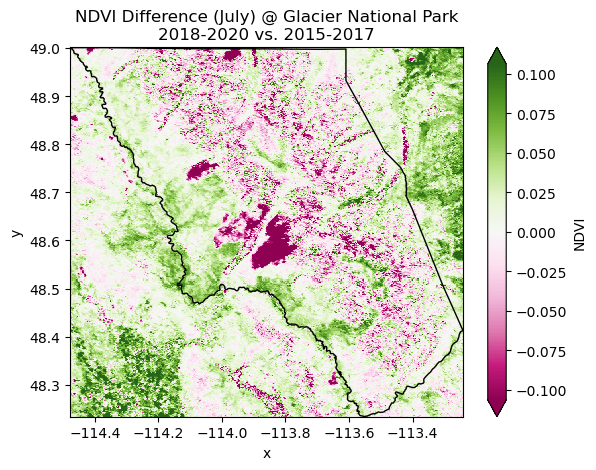
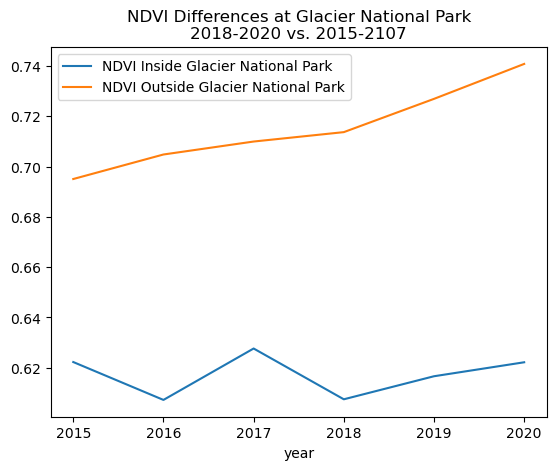
Below is an open EDS workflow that analyzes NDVI data from MODIS accessed using the NASA AppEEARS API. Through this analysis we calcuate the difference in NDVI between two 3-year time periods (2015-2017 and 2018-2020), along with looking at differences in NDVI inside and outside the park from 2015-2020. This analysis resulted in the two following plots that are summarized with the brief headline and description. The full analysis is also included, as well as the code written to create the plots.

Figure 1 - NDVI difference at Glacier National Park 2018-2020 vs. 2015-2017

Figure 2 - NDVI over time; inside and outside Glacier National Park; 2015-2020


Glacier National Park is greening up ... sort of?

Comparing normalized difference vegetative index (NDVI) data from 2015-2020 at Glacier National Park reveals that the area inside and outside the park is getting greener over time. The data from this time period also reveal a number of burn scars that are likely from the Howe Ridge (2018) and Sprague (2017) fires near Lake McDonald [5]. There is also widespread decrease in vegetative health throughout the park, potentially due to beetle kill or other forest pathogens. More data would be needed to confirm this hypothesis.

Repeat photography at Glacier National Park; source USGS Boulder Glacier; Glacier National Park; Image Credit: Morton Elrod, 1910, U of M Collection, Fagre/Pederson, 2007, USGS

Complete workflow

Below is the entire workflow needed to complete this analysis including code to access the NASA AppEEARS API an creating the plots shown above.

In [1]:
# Import python libraries
import getpass
import json
import os
import pathlib
from glob import glob

import pandas as pd
import geopandas as gpd
import matplotlib.pyplot as plt

import earthpy.appeears as eaapp
import hvplot.pandas
import hvplot.xarray
import rioxarray as rxr
import xarray as xr

Creating a boundary for Glacier National Park

In [2]:
# Read in all National Park Boundaries (US)
nps_boundary = gpd.read_file("http://gstore.unm.edu/apps/rgisarchive/"
                             "datasets/7bbe8af5-029b-4adf-b06c-134f0dd57226/"
                             "nps_boundary.original.zip")
nps_boundary
Out[2]:
GIS_LOC_ID UNIT_CODE GROUP_CODE UNIT_NAME UNIT_TYPE META_MIDF LANDS_CODE DATE_EDIT GIS_NOTES geometry
0 None UPDE None Upper Delaware Scenic and Recreational River None None 2006-06-06 POC for this update: leslie_morlock@nps.gov -... POLYGON ((-74.92112 41.49030, -74.91918 41.491...
1 None BAND None Bandelier National Monument None None None Park Created Boundary - contact Kay Beeley MULTIPOLYGON (((-106.19585 35.85378, -106.2214...
2 None ACAD None Acadia National Park None None None Shift 0.03 mi. MULTIPOLYGON (((-68.22595 44.39584, -68.22766 ...
3 None ROCR None Achbold Parkway Park None None None None MULTIPOLYGON (((-77.08430 38.91673, -77.08482 ...
4 None ADAM None Adams National Historical Park None None None Shift 0.03 mi. POLYGON ((-71.00948 42.25625, -71.01133 42.255...
... ... ... ... ... ... ... ... ... ... ...
505 None CLBA None Clara Barton National Historic Site None None 2008-11-17 Lands - http://landsnet.nps.gov/tractsnet/docu... POLYGON ((-77.14072 38.96699, -77.14075 38.967...
506 None FOWA None Fort Washington Park Park None None 2008-11-17 Lands - http://landsnet.nps.gov/tractsnet/docu... POLYGON ((-77.02299 38.72054, -77.02032 38.718...
507 None KICA None Kings Canyon National Park None None 2003-11-07 Lands MULTIPOLYGON (((-118.77919 37.23609, -118.7791...
508 None SEQU None Sequoia National Park None None 2004-01-09 Lands POLYGON ((-118.70637 36.66475, -118.70636 36.6...
509 None CABR None Cabrillo National Monument None None 2008-08-28 Lands - http://landsnet.nps.gov/tractsnet/docu... POLYGON ((-117.23862 32.66936, -117.24036 32.6...

510 rows × 10 columns

In [3]:
# Select out Glacier National Park
glacier = nps_boundary[nps_boundary["UNIT_NAME"] == "Glacier"]
glacier
Out[3]:
GIS_LOC_ID UNIT_CODE GROUP_CODE UNIT_NAME UNIT_TYPE META_MIDF LANDS_CODE DATE_EDIT GIS_NOTES geometry
361 None GLAC None Glacier National Park None None 2006-03-09 POC for this update: richard_menicke@nps.gov ... POLYGON ((-114.47552 49.00091, -114.46101 49.0...
In [4]:
# Plot the boundary to inspect
glacier.explore()
Out[4]:
Make this Notebook Trusted to load map: File -> Trust Notebook
In [5]:
# Create a path to the data
glacier_dir = os.path.join(pathlib.Path.home(), 'glacier-data')

# Make the data directory
os.makedirs(glacier_dir, exist_ok=True)

glacier_dir
Out[5]:
'/home/jovyan/glacier-data'

Downloading and preparing the data

In [6]:
# Initialize AppeearsDownloader for MODIS NDVI data
ndvi_downloader = eaapp.AppeearsDownloader(
    download_key='glacier-ndvi',
    ea_dir=glacier_dir,
    product='MOD13Q1.061',
    layer='_250m_16_days_NDVI',
    start_date="07-01",
    end_date="07-31",
    recurring=True,
    year_range=[2015, 2020],
    polygon=glacier
)

ndvi_downloader.download_files(cache=True)
In [6]:
# Get a list of NDVI tif file paths
glacier_paths = sorted(glob(os.path.join(glacier_dir, 'glacier-ndvi', '*', '*NDVI*.tif')))
len(glacier_paths)
Out[6]:
18
In [8]:
scale_factor = 10000
doy_start = -19
doy_end = -12
In [9]:
# Build data list of data arrays
glacier_das = []
for glacier_path in glacier_paths:
    # Get date from file name
    doy = glacier_path[doy_start:doy_end]
    date = pd.to_datetime(doy, format='%Y%j')

    # Open dataset
    da = rxr.open_rasterio(glacier_path, masked=True).squeeze()

    # Add date dimension and clean up metadata
    da = da.assign_coords({'date': date})
    da = da.expand_dims({'date': 1})
    da.name = 'NDVI'

    # Multiple by scale factor
    da = da / scale_factor

    # Prepare for concatenation
    glacier_das.append(da)

len(glacier_das)
Out[9]:
18
In [10]:
# Combine into single array by date
glacier_da = xr.combine_by_coords(glacier_das, coords=['date'])
glacier_da
Out[10]:
<xarray.Dataset>
Dimensions:      (x: 593, y: 369, date: 18)
Coordinates:
    band         int64 1
  * x            (x) float64 -114.5 -114.5 -114.5 ... -113.2 -113.2 -113.2
  * y            (y) float64 49.0 49.0 49.0 48.99 ... 48.24 48.24 48.24 48.23
    spatial_ref  int64 0
  * date         (date) datetime64[ns] 2015-06-26 2015-07-12 ... 2020-07-27
Data variables:
    NDVI         (date, y, x) float32 0.5447 0.5447 0.6585 ... 0.7097 0.7097
xarray.Dataset
    • x: 593
    • y: 369
    • date: 18
    • band
      ()
      int64
      1
      array(1)
    • x
      (x)
      float64
      -114.5 -114.5 ... -113.2 -113.2
      array([-114.476042, -114.473958, -114.471875, ..., -113.246875, -113.244792,
             -113.242708])
    • y
      (y)
      float64
      49.0 49.0 49.0 ... 48.24 48.23
      array([49.001042, 48.998958, 48.996875, ..., 48.238542, 48.236458, 48.234375])
    • spatial_ref
      ()
      int64
      0
      crs_wkt :
      GEOGCS["WGS 84",DATUM["WGS_1984",SPHEROID["WGS 84",6378137,298.257223563,AUTHORITY["EPSG","7030"]],AUTHORITY["EPSG","6326"]],PRIMEM["Greenwich",0,AUTHORITY["EPSG","8901"]],UNIT["degree",0.0174532925199433,AUTHORITY["EPSG","9122"]],AXIS["Latitude",NORTH],AXIS["Longitude",EAST],AUTHORITY["EPSG","4326"]]
      semi_major_axis :
      6378137.0
      semi_minor_axis :
      6356752.314245179
      inverse_flattening :
      298.257223563
      reference_ellipsoid_name :
      WGS 84
      longitude_of_prime_meridian :
      0.0
      prime_meridian_name :
      Greenwich
      geographic_crs_name :
      WGS 84
      horizontal_datum_name :
      World Geodetic System 1984
      grid_mapping_name :
      latitude_longitude
      spatial_ref :
      GEOGCS["WGS 84",DATUM["WGS_1984",SPHEROID["WGS 84",6378137,298.257223563,AUTHORITY["EPSG","7030"]],AUTHORITY["EPSG","6326"]],PRIMEM["Greenwich",0,AUTHORITY["EPSG","8901"]],UNIT["degree",0.0174532925199433,AUTHORITY["EPSG","9122"]],AXIS["Latitude",NORTH],AXIS["Longitude",EAST],AUTHORITY["EPSG","4326"]]
      GeoTransform :
      -114.47708332307788 0.0020833333331466974 0.0 49.00208332894347 0.0 -0.0020833333331466974
      array(0)
    • date
      (date)
      datetime64[ns]
      2015-06-26 ... 2020-07-27
      array(['2015-06-26T00:00:00.000000000', '2015-07-12T00:00:00.000000000',
             '2015-07-28T00:00:00.000000000', '2016-06-25T00:00:00.000000000',
             '2016-07-11T00:00:00.000000000', '2016-07-27T00:00:00.000000000',
             '2017-06-26T00:00:00.000000000', '2017-07-12T00:00:00.000000000',
             '2017-07-28T00:00:00.000000000', '2018-06-26T00:00:00.000000000',
             '2018-07-12T00:00:00.000000000', '2018-07-28T00:00:00.000000000',
             '2019-06-26T00:00:00.000000000', '2019-07-12T00:00:00.000000000',
             '2019-07-28T00:00:00.000000000', '2020-06-25T00:00:00.000000000',
             '2020-07-11T00:00:00.000000000', '2020-07-27T00:00:00.000000000'],
            dtype='datetime64[ns]')
    • NDVI
      (date, y, x)
      float32
      0.5447 0.5447 ... 0.7097 0.7097
      array([[[0.5447, 0.5447, 0.6585, ..., 0.8173, 0.832 , 0.832 ],
              [0.5769, 0.5408, 0.561 , ..., 0.7763, 0.7725, 0.832 ],
              [0.6659, 0.6659, 0.5408, ..., 0.7578, 0.7725, 0.7725],
              ...,
              [0.7366, 0.7622, 0.7622, ..., 0.7493, 0.7206, 0.7206],
              [0.7533, 0.7533, 0.7777, ..., 0.6806, 0.6806, 0.7206],
              [0.7139, 0.7636, 0.7636, ..., 0.5371, 0.6806, 0.6806]],
      
             [[0.6447, 0.6447, 0.6695, ..., 0.7528, 0.7857, 0.7857],
              [0.5996, 0.5996, 0.669 , ..., 0.7421, 0.7623, 0.7857],
              [0.7458, 0.7458, 0.5996, ..., 0.7421, 0.7623, 0.7623],
              ...,
              [0.7816, 0.7809, 0.7809, ..., 0.7702, 0.7488, 0.7488],
              [0.7841, 0.7841, 0.7809, ..., 0.7335, 0.7335, 0.693 ],
              [0.7675, 0.7816, 0.7816, ..., 0.6231, 0.6546, 0.6546]],
      
             [[0.5584, 0.5584, 0.6954, ..., 0.7219, 0.692 , 0.692 ],
              [0.5573, 0.4936, 0.6954, ..., 0.6881, 0.7219, 0.7325],
              [0.6886, 0.6886, 0.5887, ..., 0.7167, 0.7322, 0.7322],
              ...,
      ...
              [0.771 , 0.7731, 0.7731, ..., 0.7174, 0.684 , 0.684 ],
              [0.771 , 0.771 , 0.7769, ..., 0.6597, 0.6597, 0.5493],
              [0.7613, 0.7769, 0.7769, ..., 0.704 , 0.6564, 0.6564]],
      
             [[0.6542, 0.6542, 0.76  , ..., 0.7848, 0.8278, 0.8278],
              [0.6807, 0.6666, 0.763 , ..., 0.8117, 0.78  , 0.8278],
              [0.8111, 0.8111, 0.7676, ..., 0.7813, 0.8058, 0.8058],
              ...,
              [0.7831, 0.8209, 0.8209, ..., 0.8113, 0.8042, 0.8042],
              [0.8254, 0.8254, 0.8209, ..., 0.7148, 0.7148, 0.7134],
              [0.8184, 0.8254, 0.8254, ..., 0.6909, 0.6972, 0.6972]],
      
             [[0.627 , 0.627 , 0.73  , ..., 0.7044, 0.7158, 0.7158],
              [0.6401, 0.6102, 0.7485, ..., 0.7206, 0.7366, 0.812 ],
              [0.682 , 0.682 , 0.6695, ..., 0.7449, 0.77  , 0.77  ],
              ...,
              [0.7775, 0.803 , 0.803 , ..., 0.7913, 0.7678, 0.7678],
              [0.8184, 0.8184, 0.8158, ..., 0.7507, 0.7507, 0.7616],
              [0.7887, 0.8097, 0.8097, ..., 0.5577, 0.7097, 0.7097]]],
            dtype=float32)
    • x
      PandasIndex
      PandasIndex(Index([ -114.4760416564113, -114.47395832307815,   -114.471874989745,
             -114.46979165641186, -114.46770832307871, -114.46562498974556,
             -114.46354165641242, -114.46145832307927, -114.45937498974612,
             -114.45729165641298,
             ...
             -113.26145832318677, -113.25937498985363, -113.25729165652048,
             -113.25520832318733, -113.25312498985419, -113.25104165652104,
             -113.24895832318789, -113.24687498985475,  -113.2447916565216,
             -113.24270832318845],
            dtype='float64', name='x', length=593))
    • y
      PandasIndex
      PandasIndex(Index([  49.0010416622769,  48.99895832894375, 48.996874995610604,
              48.99479166227746,  48.99270832894431, 48.990624995611164,
              48.98854166227802,  48.98645832894487, 48.984374995611724,
              48.98229166227858,
             ...
              48.25312499567723, 48.251041662344086,  48.24895832901094,
              48.24687499567779, 48.244791662344646,   48.2427083290115,
              48.24062499567835, 48.238541662345206,  48.23645832901206,
              48.23437499567891],
            dtype='float64', name='y', length=369))
    • date
      PandasIndex
      PandasIndex(DatetimeIndex(['2015-06-26', '2015-07-12', '2015-07-28', '2016-06-25',
                     '2016-07-11', '2016-07-27', '2017-06-26', '2017-07-12',
                     '2017-07-28', '2018-06-26', '2018-07-12', '2018-07-28',
                     '2019-06-26', '2019-07-12', '2019-07-28', '2020-06-25',
                     '2020-07-11', '2020-07-27'],
                    dtype='datetime64[ns]', name='date', freq=None))
In [11]:
# Compute the difference in NDVI before and 2017/2018
glacier_diff = (
    glacier_da
        .sel(date=slice('2018', '2020'))
        .mean('date')
        .NDVI 
   - glacier_da
        .sel(date=slice('2015', '2017'))
        .mean('date')
        .NDVI
)

glacier_diff
Out[11]:
<xarray.DataArray 'NDVI' (y: 369, x: 593)>
array([[ 0.00964445,  0.00964445, -0.00370002, ...,  0.07951105,
         0.09175545,  0.09175545],
       [ 0.03782219,  0.03242224,  0.01788896, ...,  0.09422225,
         0.07023335,  0.0790112 ],
       [ 0.03799999,  0.03799999,  0.04133326, ...,  0.06477785,
         0.06571102,  0.06571102],
       ...,
       [ 0.00105554,  0.00936663,  0.00936663, ..., -0.00990003,
        -0.02216661, -0.02216661],
       [ 0.01837778,  0.01837778,  0.00757778, ..., -0.03024441,
        -0.03024441, -0.03652221],
       [ 0.01888889,  0.01841098,  0.01841098, ..., -0.04922229,
        -0.01131105, -0.01131105]], dtype=float32)
Coordinates:
    band         int64 1
  * x            (x) float64 -114.5 -114.5 -114.5 ... -113.2 -113.2 -113.2
  * y            (y) float64 49.0 49.0 49.0 48.99 ... 48.24 48.24 48.24 48.23
    spatial_ref  int64 0
xarray.DataArray
'NDVI'
  • y: 369
  • x: 593
  • 0.009644 0.009644 -0.0037 -0.001745 ... -0.04922 -0.01131 -0.01131
    array([[ 0.00964445,  0.00964445, -0.00370002, ...,  0.07951105,
             0.09175545,  0.09175545],
           [ 0.03782219,  0.03242224,  0.01788896, ...,  0.09422225,
             0.07023335,  0.0790112 ],
           [ 0.03799999,  0.03799999,  0.04133326, ...,  0.06477785,
             0.06571102,  0.06571102],
           ...,
           [ 0.00105554,  0.00936663,  0.00936663, ..., -0.00990003,
            -0.02216661, -0.02216661],
           [ 0.01837778,  0.01837778,  0.00757778, ..., -0.03024441,
            -0.03024441, -0.03652221],
           [ 0.01888889,  0.01841098,  0.01841098, ..., -0.04922229,
            -0.01131105, -0.01131105]], dtype=float32)
    • band
      ()
      int64
      1
      array(1)
    • x
      (x)
      float64
      -114.5 -114.5 ... -113.2 -113.2
      array([-114.476042, -114.473958, -114.471875, ..., -113.246875, -113.244792,
             -113.242708])
    • y
      (y)
      float64
      49.0 49.0 49.0 ... 48.24 48.23
      array([49.001042, 48.998958, 48.996875, ..., 48.238542, 48.236458, 48.234375])
    • spatial_ref
      ()
      int64
      0
      crs_wkt :
      GEOGCS["WGS 84",DATUM["WGS_1984",SPHEROID["WGS 84",6378137,298.257223563,AUTHORITY["EPSG","7030"]],AUTHORITY["EPSG","6326"]],PRIMEM["Greenwich",0,AUTHORITY["EPSG","8901"]],UNIT["degree",0.0174532925199433,AUTHORITY["EPSG","9122"]],AXIS["Latitude",NORTH],AXIS["Longitude",EAST],AUTHORITY["EPSG","4326"]]
      semi_major_axis :
      6378137.0
      semi_minor_axis :
      6356752.314245179
      inverse_flattening :
      298.257223563
      reference_ellipsoid_name :
      WGS 84
      longitude_of_prime_meridian :
      0.0
      prime_meridian_name :
      Greenwich
      geographic_crs_name :
      WGS 84
      horizontal_datum_name :
      World Geodetic System 1984
      grid_mapping_name :
      latitude_longitude
      spatial_ref :
      GEOGCS["WGS 84",DATUM["WGS_1984",SPHEROID["WGS 84",6378137,298.257223563,AUTHORITY["EPSG","7030"]],AUTHORITY["EPSG","6326"]],PRIMEM["Greenwich",0,AUTHORITY["EPSG","8901"]],UNIT["degree",0.0174532925199433,AUTHORITY["EPSG","9122"]],AXIS["Latitude",NORTH],AXIS["Longitude",EAST],AUTHORITY["EPSG","4326"]]
      GeoTransform :
      -114.47708332307788 0.0020833333331466974 0.0 49.00208332894347 0.0 -0.0020833333331466974
      array(0)
    • x
      PandasIndex
      PandasIndex(Index([ -114.4760416564113, -114.47395832307815,   -114.471874989745,
             -114.46979165641186, -114.46770832307871, -114.46562498974556,
             -114.46354165641242, -114.46145832307927, -114.45937498974612,
             -114.45729165641298,
             ...
             -113.26145832318677, -113.25937498985363, -113.25729165652048,
             -113.25520832318733, -113.25312498985419, -113.25104165652104,
             -113.24895832318789, -113.24687498985475,  -113.2447916565216,
             -113.24270832318845],
            dtype='float64', name='x', length=593))
    • y
      PandasIndex
      PandasIndex(Index([  49.0010416622769,  48.99895832894375, 48.996874995610604,
              48.99479166227746,  48.99270832894431, 48.990624995611164,
              48.98854166227802,  48.98645832894487, 48.984374995611724,
              48.98229166227858,
             ...
              48.25312499567723, 48.251041662344086,  48.24895832901094,
              48.24687499567779, 48.244791662344646,   48.2427083290115,
              48.24062499567835, 48.238541662345206,  48.23645832901206,
              48.23437499567891],
            dtype='float64', name='y', length=369))

Plotting the NDVI difference spatially

NOTE: Remember to try the .hvplot approach now that the environment is rebuilt?

In [12]:
# Plot the difference
fig, ax = plt.subplots()

glacier_diff.plot(x='x', y='y', cmap='PiYG', robust=True, ax=ax)
glacier.plot(edgecolor='black', color='none', ax=ax)
plt.title('NDVI Difference (July) @ Glacier National Park\n2018-2020 vs. 2015-2017')
plt.show()
No description has been provided for this image

Looking at how NDVI changes with time

In [14]:
glacier_out_gdf = (
    gpd.GeoDataFrame(geometry=glacier.envelope)
    .overlay(glacier, how='difference'))
In [15]:
# Clip data to both inside and outside the boundary
ndvi_glacier_da = glacier_da.rio.clip(glacier.geometry, from_disk=True)
ndvi_glacier_out_da = glacier_da.rio.clip(glacier_out_gdf.geometry, from_disk=True)
In [16]:
# Compute mean annual July NDVI
jul_ndvi_glacier_df = (
    ndvi_glacier_da
    .groupby(ndvi_glacier_da.date.dt.year)
    .mean(...)
    .NDVI.to_dataframe())
jul_ndvi_glacier_out_df = (
    ndvi_glacier_out_da
    .groupby(ndvi_glacier_out_da.date.dt.year)
    .mean(...)
    .NDVI.to_dataframe())

# Plot inside and outside the reservation
glacier_ndvi_df = (
    jul_ndvi_glacier_df[['NDVI']]
    .join(
        jul_ndvi_glacier_out_df[['NDVI']], 
        lsuffix=' Inside Glacier National Park', rsuffix=' Outside Glacier National Park')
)
In [17]:
# Plot difference inside and outside the reservation
glacier_ndvi_df.plot(
    title='NDVI Differences at Glacier National Park\n2018-2020 vs. 2015-2107')
Out[17]:
<Axes: title={'center': 'NDVI Differences at Glacier National Park\n2018-2020 vs. 2015-2107'}, xlabel='year'>
No description has been provided for this image

Create a .html (or markdown) copy of your work

In [18]:
%%capture
%%bash
jupyter nbconvert *.ipynb --to html